Technical indicators can be confusing. At first, I had a lot to learn. I learned about many different indicators; such as EMAs, SMAs, RSI, MACD, etc. To begin, I wanted an easy way to get into technical indicators that made sense.
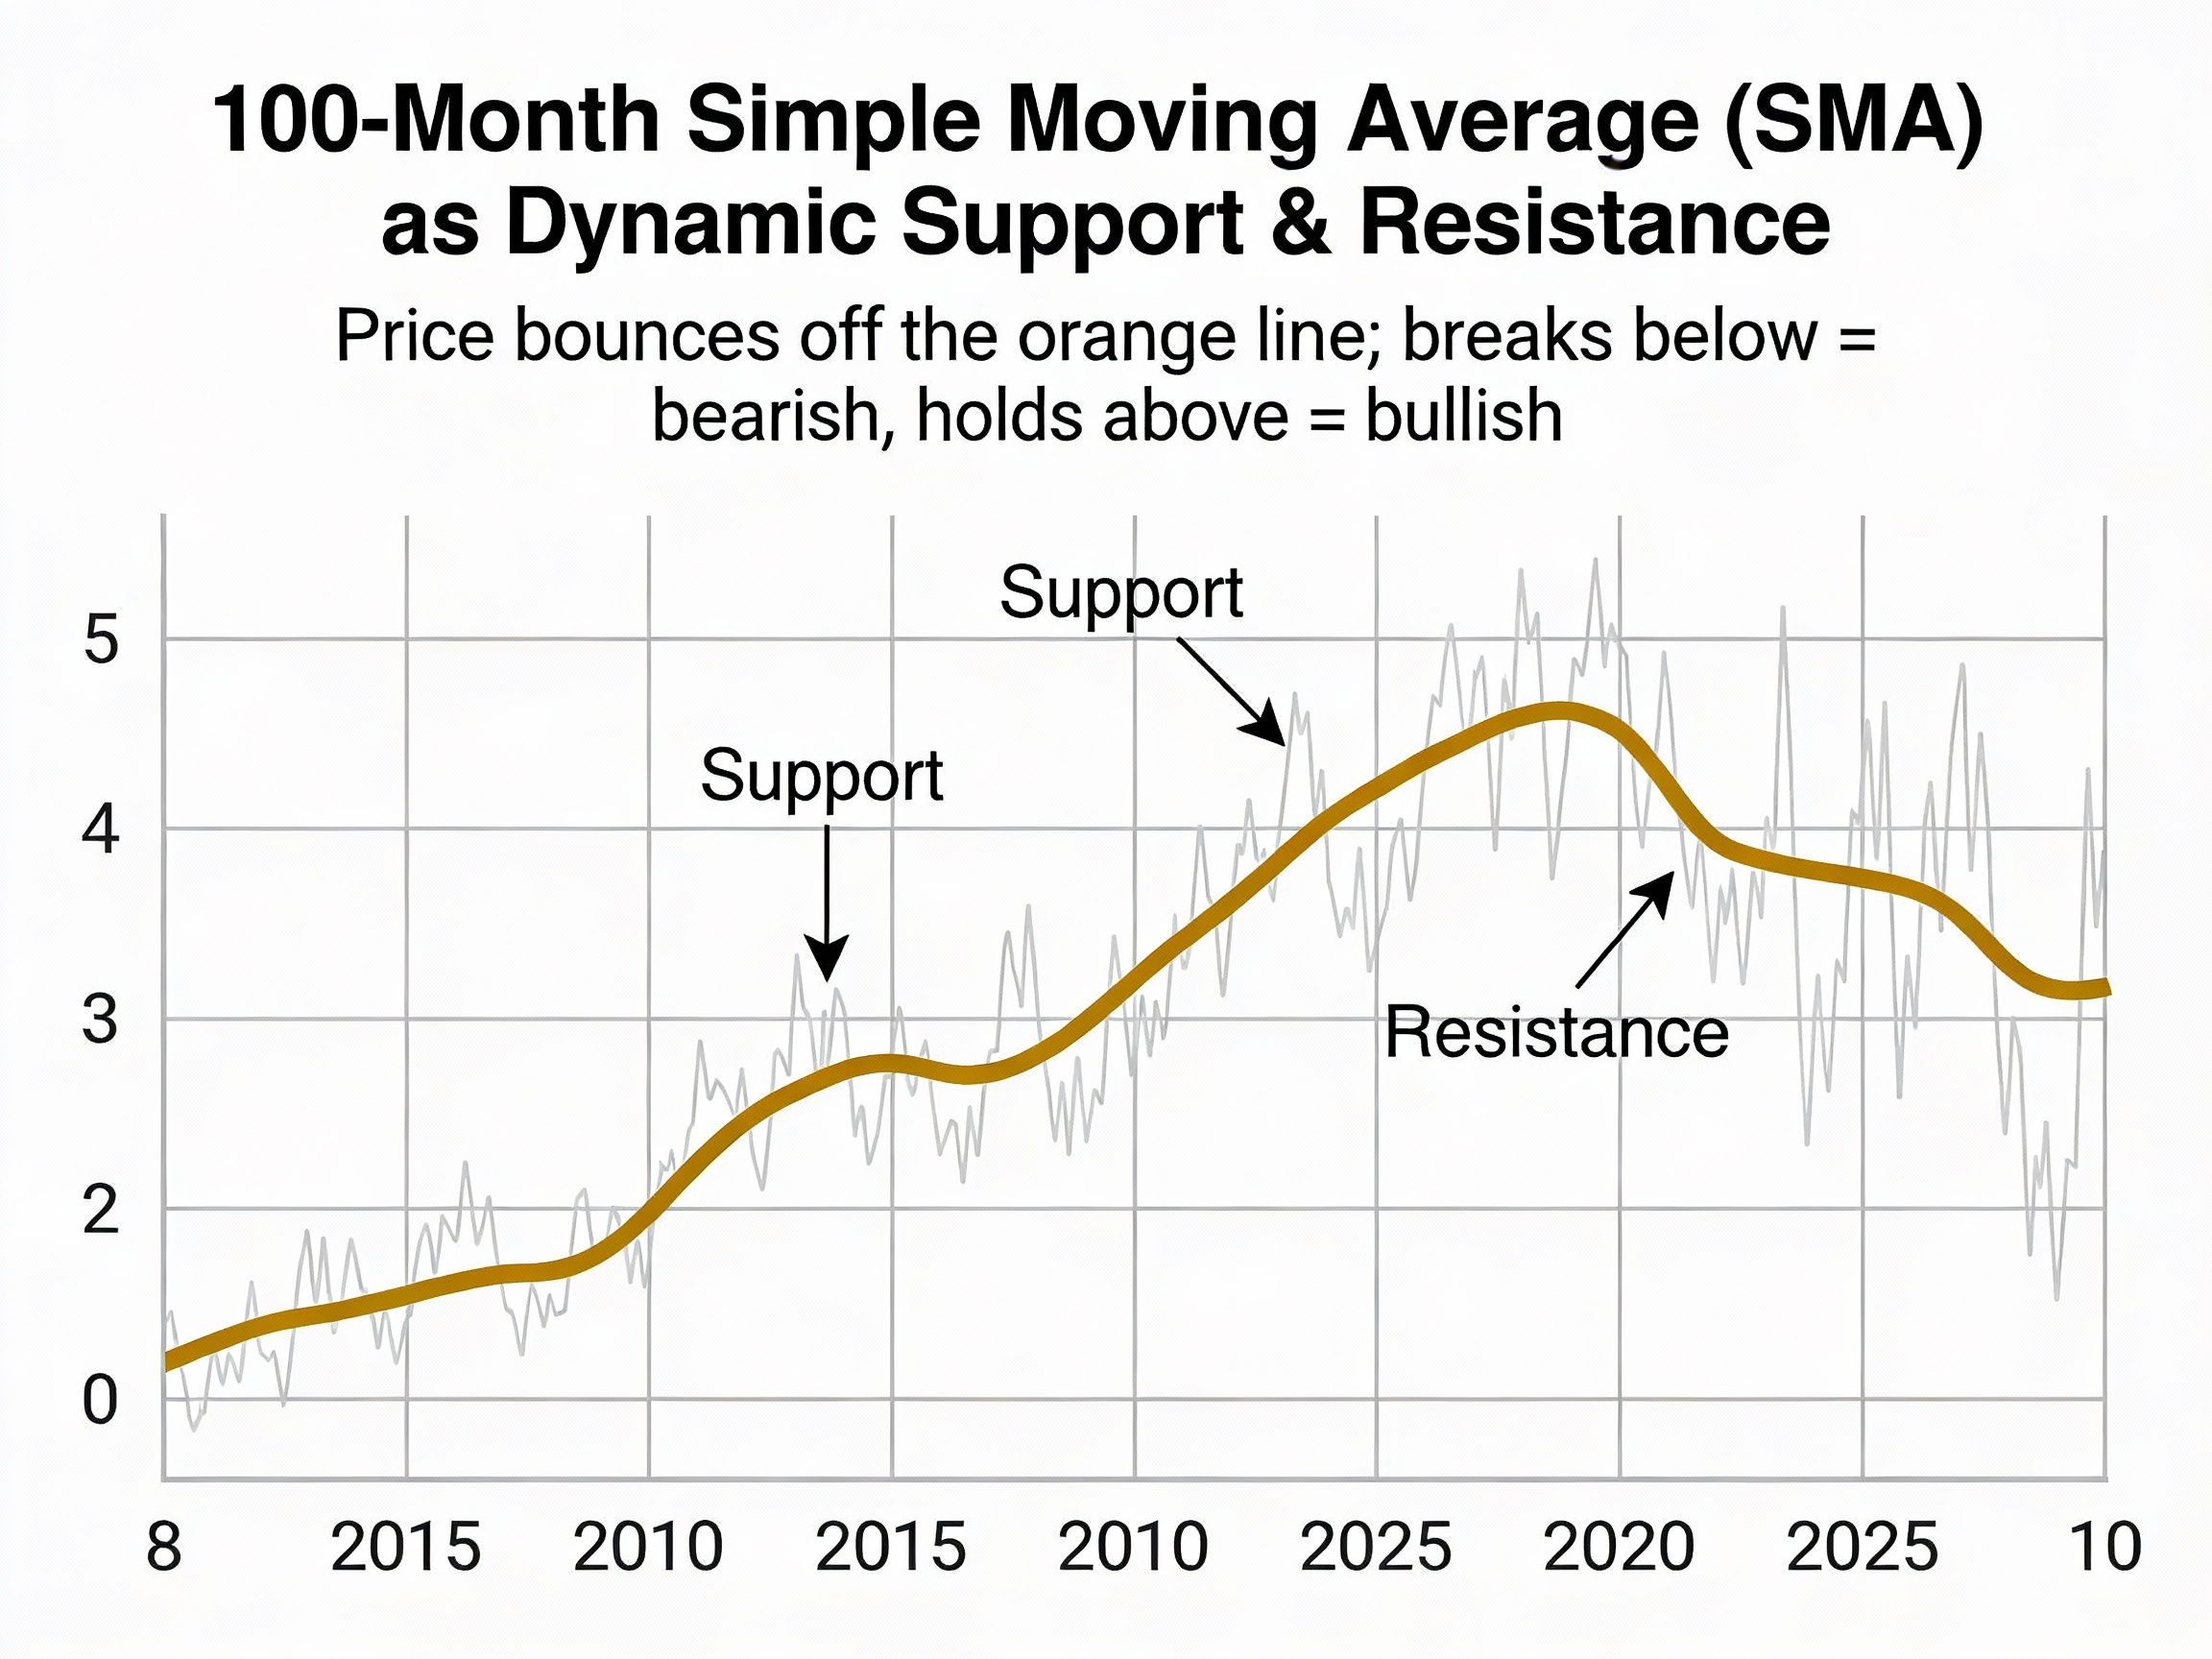
This is when I came across the 100-month Simple Moving Average.
What is the 100-month SMA?
It is just what it sounds like; the average closing price for the last 100 months. There are no weighted factors and there is no complex formula to follow. To find the average closing price simply take the last 100 month closing prices and divide by 100.
Why should we care about the 100-month Simple Moving Average? We care because 100 months of historical price data equals approximately 8 years of data. Therefore, we are not seeing daily price movements nor price volatility from day-to-day. Instead, we are viewing the larger picture of where a company or index has traded in the long term.
Why Should Beginners Use SMA Instead of EMA?
An Exponential Moving Average (EMA), weights recent price activity, allowing it to respond quickly to changes in the price of a security. While this may seem beneficial, it is not ideal for beginners. In fact, it is best to use a simpler indicator for beginners.
While using a Simple Moving Average (SMA) provides less sensitivity to price swings than the EMA, it is also easier to interpret.
Since the SMA gives equal importance to each month in the timeframe selected (in this case 100 months) it will help new users of technical indicators understand the relationship between price movements and the moving average.
Once a beginner understands how moving averages operate using a Simple Moving Average, they can go back and study the use of Exponential Moving Averages.
Why Does the 100-Month Time Frame Matter?
The key concept is that longer time frames produce stronger areas of support and resistance.
Price action in relation to a 20-day moving average can change rapidly due to several poor days. Price action related to a 100-month moving average will require years of consistent price movement to move the average in a specific direction.
Because of the influence of the number of large-cap institutions and their algorithms, these institutions rely heavily upon long-term moving averages to assist with their buy and sell decisions. These decisions result in significant buying and selling pressure on the moving average which creates a self-referential environment.rr
The Honest Reality
I’m not going to pretend the 100-month SMA is a magic line that predicts the future. It’s a lagging indicator—by definition, it tells you where price has been, not where it’s going.
Studies show that moving average signals can have high false signal rates, especially in sideways markets. The 100-month SMA isn’t a standalone trading system. It’s one tool in a larger toolkit.
But for beginners? It’s a solid starting point. It teaches you to think about long-term trends, understand support and resistance, and appreciate why certain price levels matter more than others.
My Takeaway
The 100-month SMA is part of my trading strategy because it helps me see the bigger picture. When price approaches that 8+ years of averaged data, I pay attention. Not because the line is magic, but because I know other traders are watching it too.
Start here. Understand this. Then build from it.